Can I download a list of course attendees? How can I see a list of who's registered for a course and their details (name, phone, email)?
This report lists all your individual course session bookings during any given timeframe, including no-shows.
You can combine the different filters and group the data to generate customised attendance reports for course sessions in the past, or view registrations for upcoming course sessions.
🎉 We're working on a new and improved reports design with new features! We will be applying this new visual style to all of our reports soon. Check out the new design of Course Session Attendances here. Let us know what you think in the Product Feedback Portal!
In this guide we're going to take a look at how to navigate the Course Session Attendances Report. Jump to:
🆕 A walkthrough of the new Course Session Attendances Report
➡️ A walkthrough of the old Course Session Attendances Report
🆕 A walkthrough of the new Course Session Attendances Report
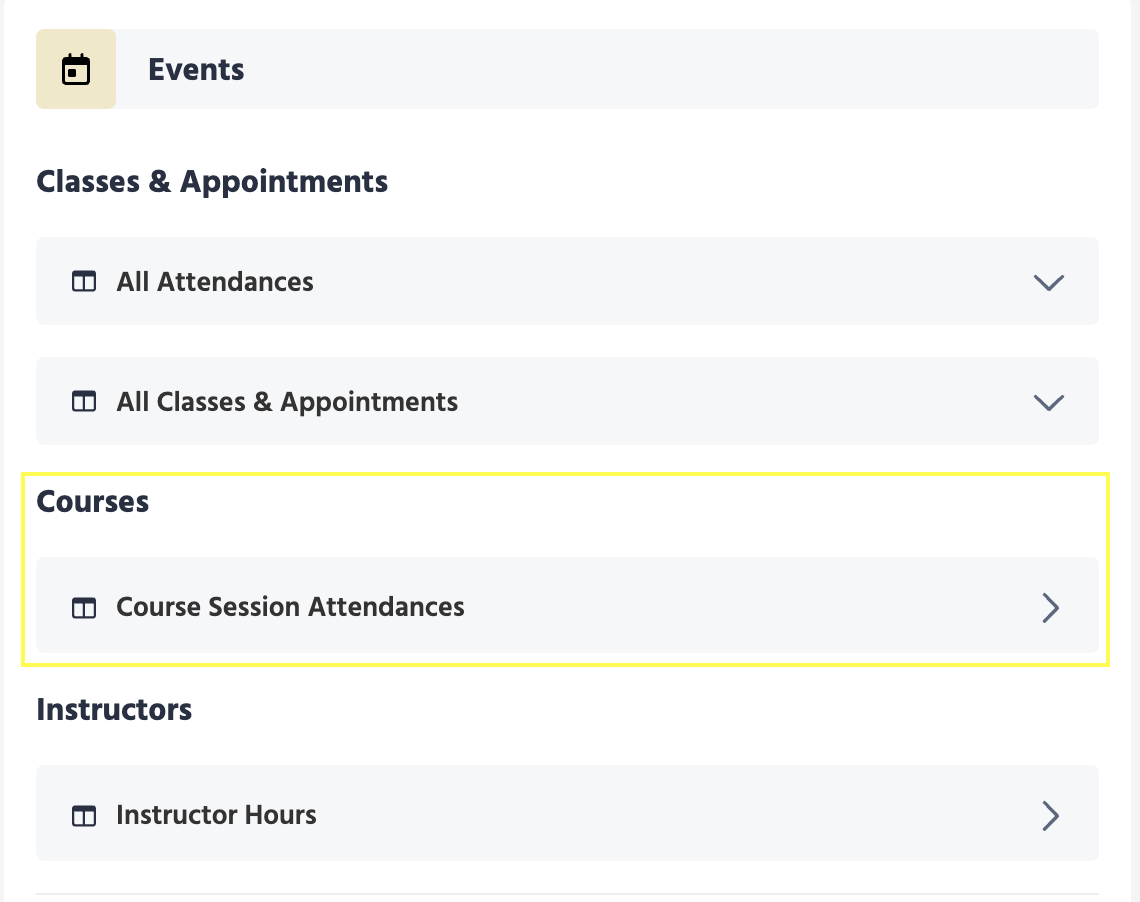
This report lives under Reports >> Events >> Courses >> Course Session Attendances.
How to use the Course Session Attendances Report
Let's take a look at how to navigate this page.
Widgets
The first thing you'll see on this page is what we call "widgets", which are quick reports that you can take a look at without having to manipulate any data.
These reports show you highlights of the last 30 days. To see the exact date range and how these trend lines are being calculated, hover over the "i" next to 'Last 30 Days'.
At glance, you'll be able to see:
- How many unique customers attended a course over the last 30 days
- Your most popular course over the last 30 days
To see the data or chart for each widget, click the 'View Report' or 'View Chart' button.
Filters and grouping options
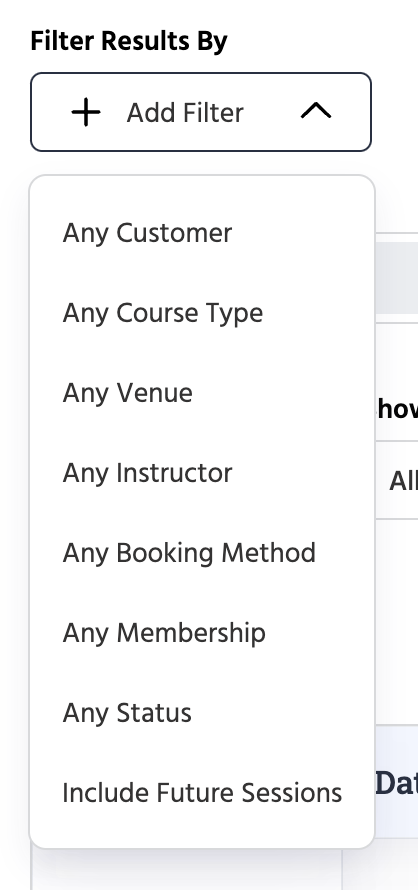
You can use the filters to narrow down the view of the data.
This list can be filtered by:
-
Any Customer. Search a customer's name.
- Any Course Type. Select one or more Course Types.
- Any Venue. Select one or more of your venues.
- Any Instructor. Search an instructor.
- Any Booking Method. Select one or multiple booking methods (Membership, Drop-in, or Free).
-
Any Membership. Select one or more membership names.
- Any Status. Select one or more attendance statuses (attended, registered, or no show).
- Include future classes. Include or exclude classes or appointments happening in the future.
View the data as a report
As you apply filters, you'll see a pill so that you can see at glance what filters have been applied. You can add multiple filters and easily clear everything by clicking the 'Clear All' pill.

Under 'Show' there are also multiple "group by" options that allow you to group the data using one or multiple dimensions.
The date filter allows you to change the date range.
If you select a "group by" option, you can change how you're looking at the totals.
View the data as a chart
These filters are sticky, so if you're filtering in a report and then move to the chart toggle, it sticks and will change to the chart view with the same data.
You can use the group by options there to generate a different chart. The chart displays 20 data points (if you filter to a shorter period of time, the banner disappears).
Underneath the chart view, you can also see the data table as reference, and as you manipulate the data table (for example, sorting), the chart updates in real-time.
You can look at the chart in different ways:
Download
To download the report, click the 'Download' button in the top right corner.
➡️ A walkthrough of the old Course Session Attendances Report
To view this report, head to Reports >> Classes and Courses >> Course Session Attendances, or Courses >> Reports .
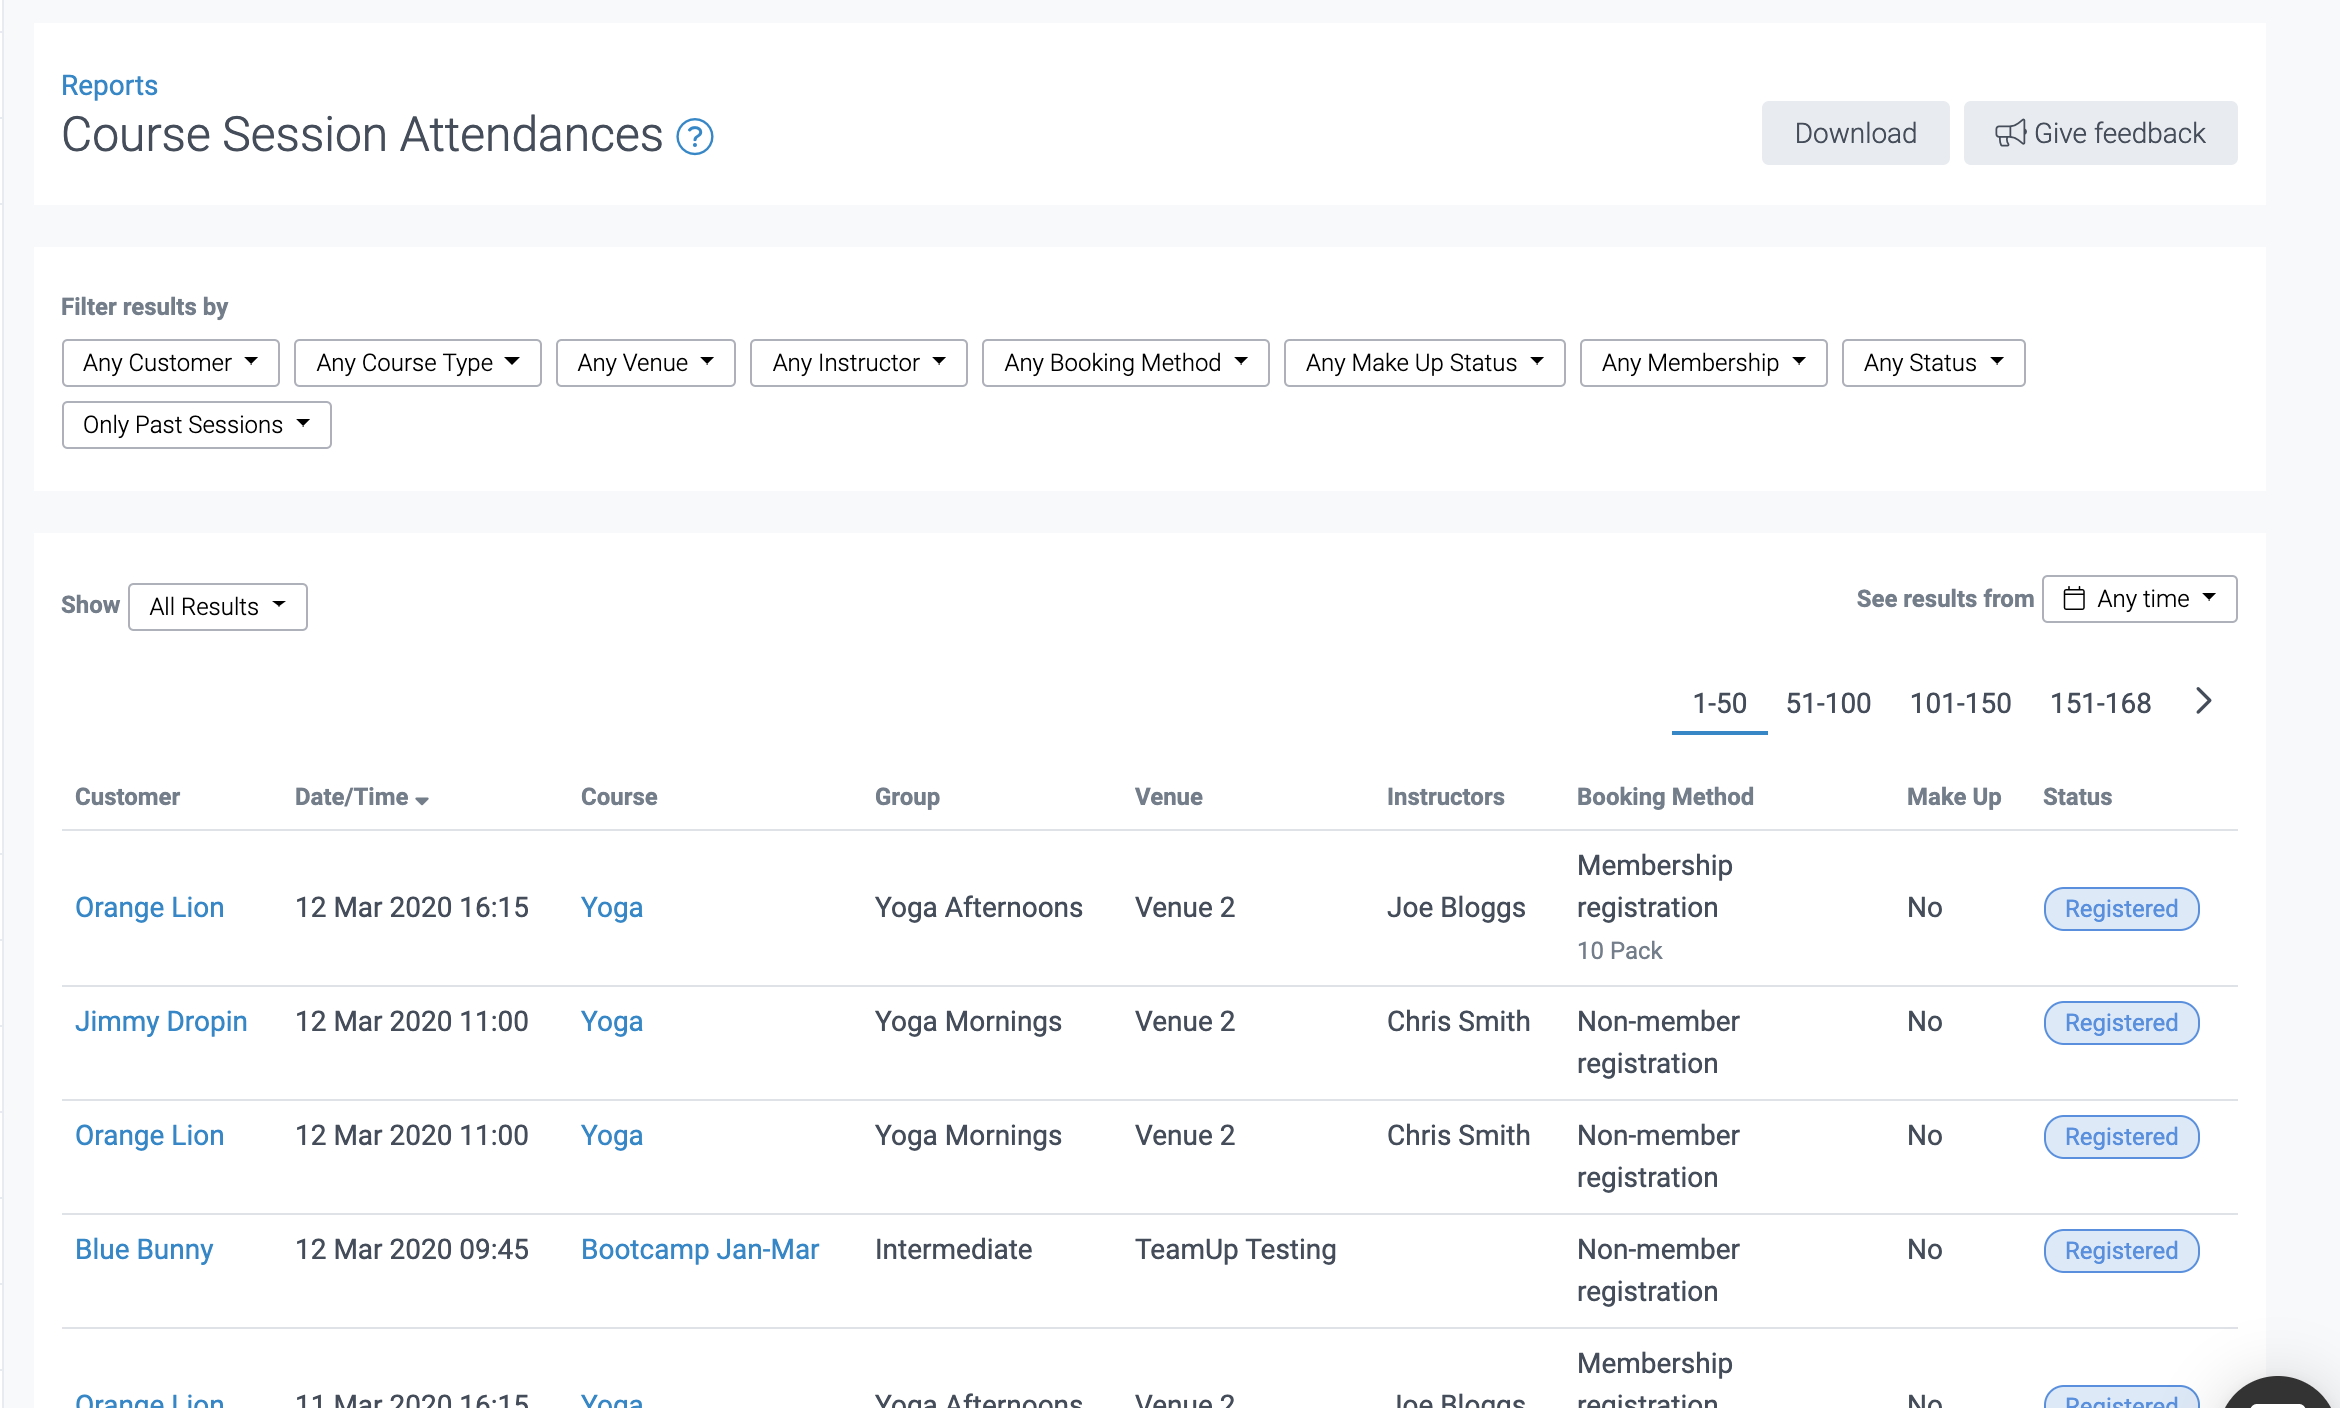
Filters
The report can be filtered by:
-
Customer
-
Course type
-
Venue
-
Instructor
-
Booking method. This filter allows you to view how the customer booked the course: membership registrations (registered using a membership credit), non-member registrations (paid the non-member price) and single-session registrations (purchased a drop-in).
-
Make up status. Yes or no depending if the customer changed the course series they originally registered for.
-
Membership. Use this filter to view any course sessions booked via a membership.
-
Status. View attendances and no-shows.
-
Past or future sessions. Use this filter to view past session attendances, or who's registered for future course sessions.
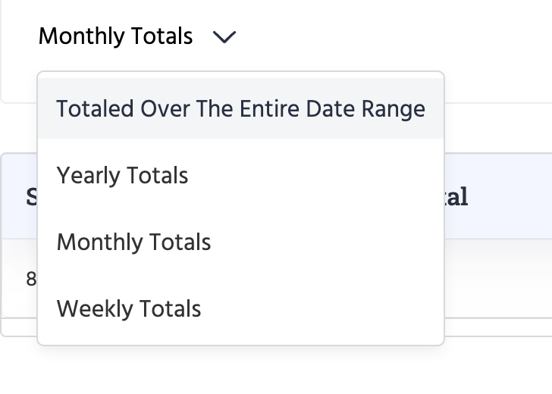
View totals
Use the 'Show' option to group by different dimensions and view totals.
For example, you might want to see the attendance count per day of the week for a specific course type:
To download this report to a .CSV file, click the 'Download' button and select any additional customer fields you want to view.
How can I generate and download a list of course attendees?
For more information on how to use this report, please see How can I download a list of all course attendees.
Jump to: